

As noted in the previous quarterly publication, the second quarter marked the peak year-over-year growth rate on several measures, including economic growth. The third quarter found growth stocks remaining on top of the heap with concerns about the Delta variant denting the returns for more economically sensitive sectors (Chart 1). However, value and dividend stocks retained the crown for performance year-to-date on the strength of the performance in the first quarter.
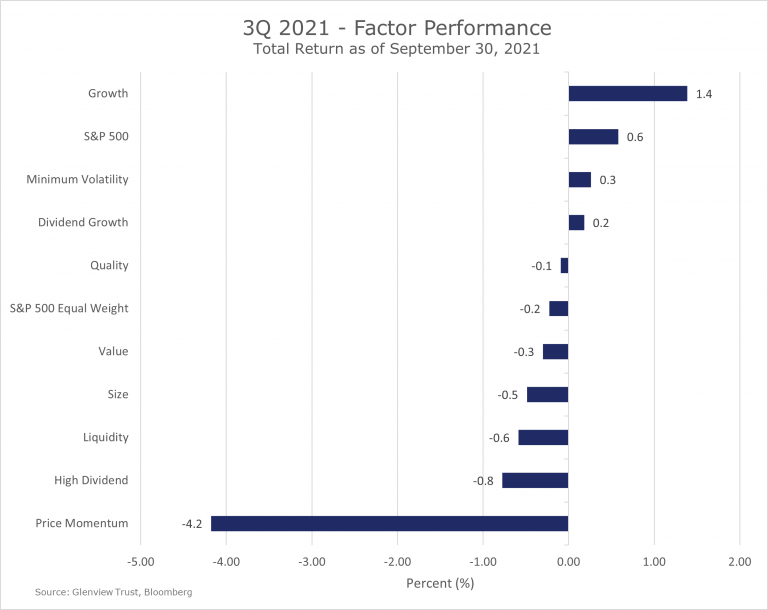
Chart 1 – 3Q Factor Performance
The markets now resemble the classic Clint Eastwood film, The Good, The Bad and the Ugly. In the movie, the three men battle for a treasure in gold. The future direction of the markets will likely be determined by the struggle between the good, bad, and ugly factors.
The Good
Corporate profits and the wealth of U.S. households are the two of the most important reasons for optimism.
Since equity ownership implies the ownership of a fraction of a company’s cash flows, earnings are the driving factor of stocks over the long term (Chart 2). S&P 500 earnings have rebounded sharply post-pandemic lockdown and should be over twenty percent higher in 2021 than the pre-pandemic levels of 2019.
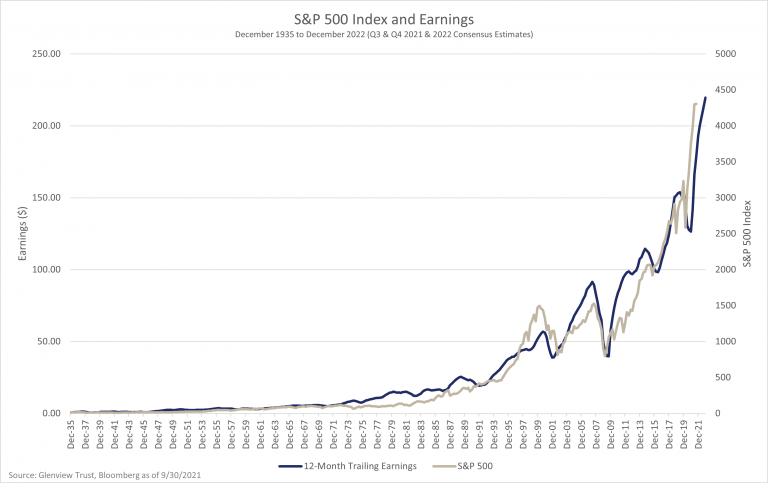
Chart 2 – S7P 500 Index and Earnings
While earnings growth will slow in 2022, corporations should still produce ample profits (Chart 3). Depending on the size of the possible corporate tax increase currently being contemplated in Congress, the expected rise in earnings for 2022 may need to be trimmed to roughly 5%. Many companies did a great job of improving productivity and profitability during Covid. Arguably, many firms are better businesses post-lockdown, or at least the markets more rightly appreciate the resilience of the businesses.
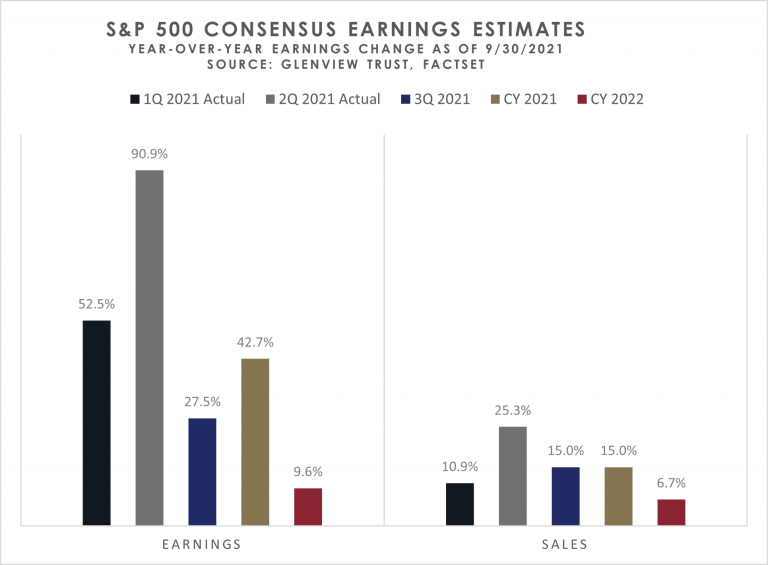
Chart 3 – S&P 500 Earnings Estimates
While segments of our population, particularly in the lower-income portions of service businesses, continue to face financial hardship due to Covid, U.S. households have a record high net worth (Chart 4). The rebound in net worth after a slight dip during the Covid-recession was staggering. This increase was driven primarily by stock and home prices, so reaching another record high for the third quarter seems likely. This wealth, combined with an improving labor market, should continue to support the consumer demand that drives the U.S. economy. While rising heating and gasoline prices provide a headwind to consumer spending, particularly for lower-income households, aggregate spending should still support economic growth.
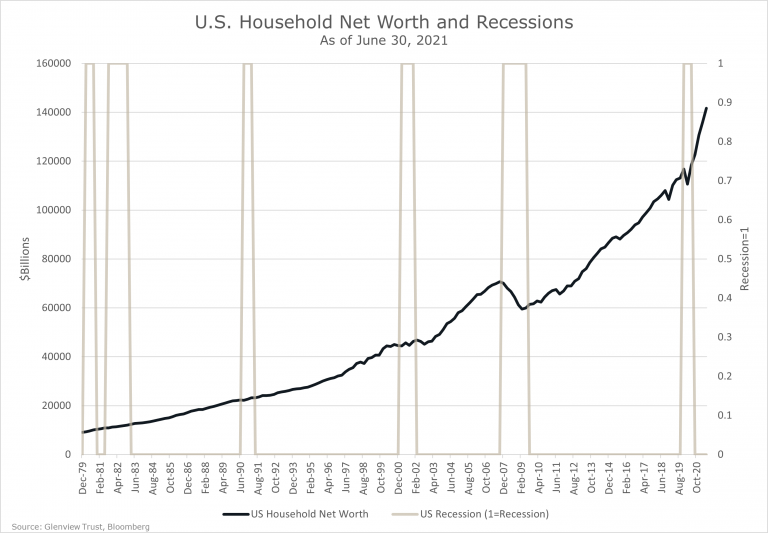
Chart 4 – U.S. Household Net Worth
Contrary to popular belief, households are not overly saddled with debt relative to income levels. Even though house prices have risen sharply, lower interest rates have kept mortgage costs among the lowest levels since 1980 (Chart 5). Other measures of household debt costs as a percent of income are near the lowest levels as well. The combination of high net worth and relatively low readings on debt service also leaves households with room to borrow to fund purchases.
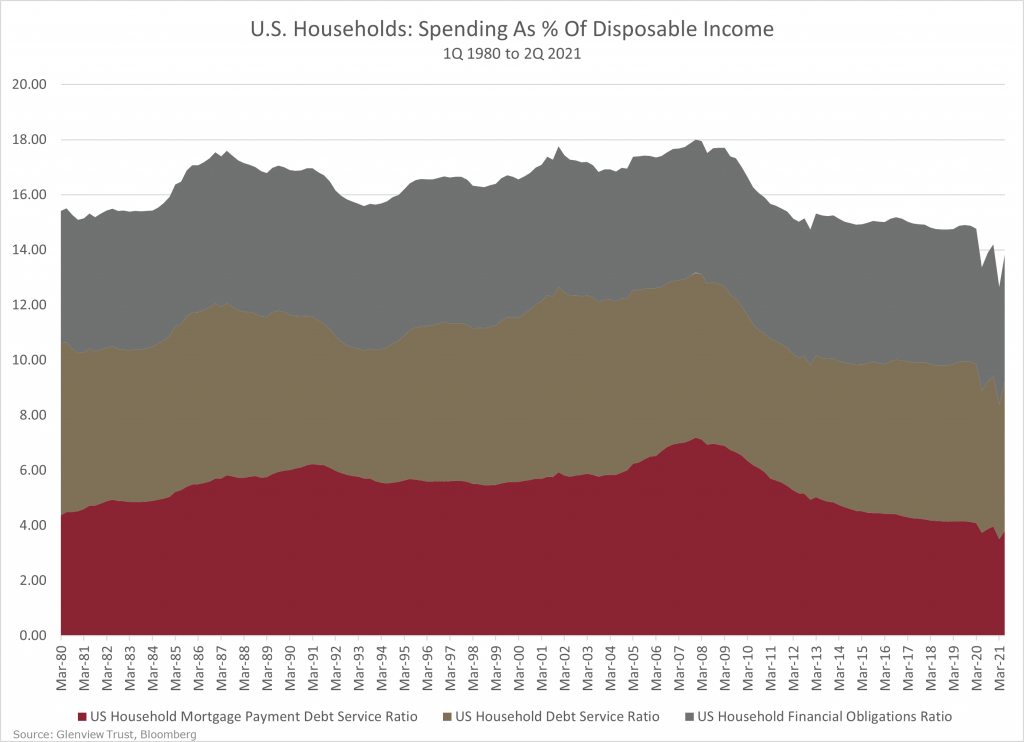
Chart 5 – U.S. Households: Spending as % of disposable income
The Bad
Economic growth slowed in the third quarter, with supply chain disruptions and the Delta-variant weighing on activity. Third-quarter GDP slowed to a 2% annualized rate from 6.7% in the second quarter. There are good reasons to believe growth should accelerate to about 4% in the fourth quarter as supply constraints ease, but the exact timing remains unclear. In any case, the level of economic growth remains below the trend line before the pandemic (Chart 6). The GDP level is also a factor contributing to the number of employed in the U.S. remaining almost 5 million below the pre-Covid peak.
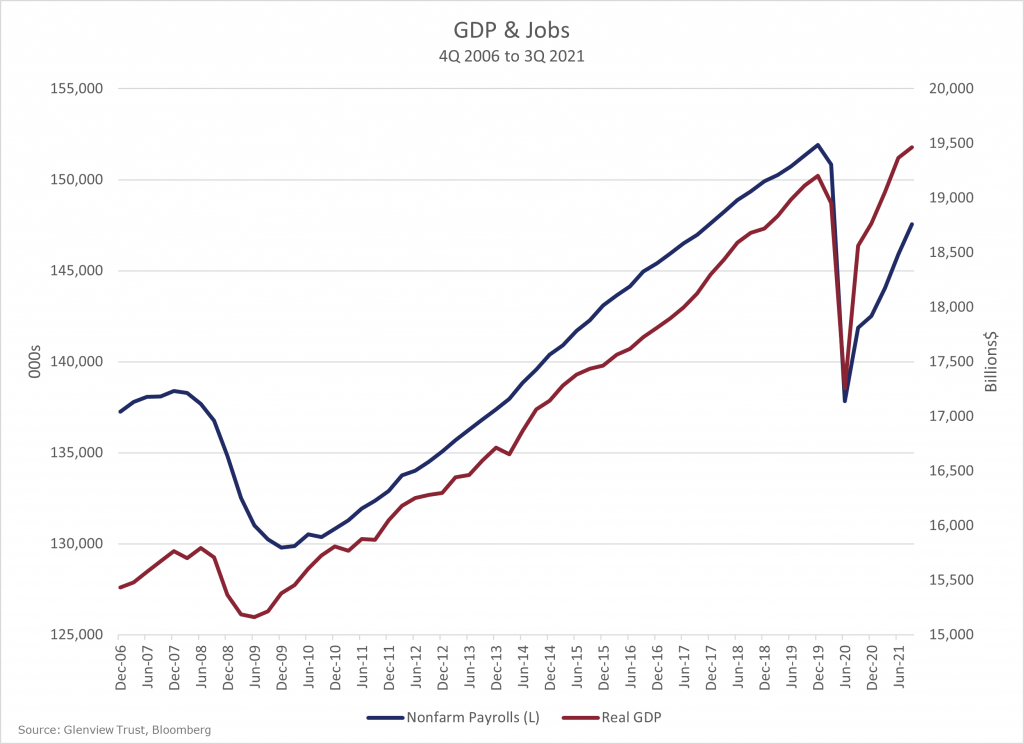
Chart 6 – GDP & Jobs
While one could easily make the case that Covid should be listed in the ugly category, the rise in U.S. cases has slowed for the moment (Chart 7). Setting aside the horrible human toll, the increase in the Delta-variant was headwind to global economic growth in the third quarter. While there are typically not complete lockdowns and better therapeutics now exist, an increase in cases typically cases some closures and decrease in consumer mobility.
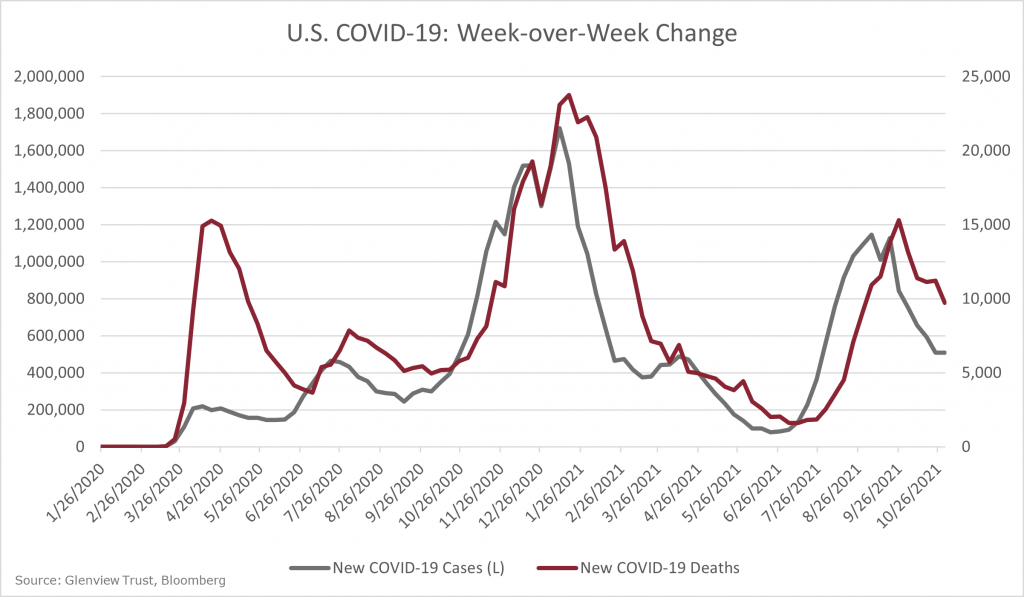
Chart 7 – U.S. COVID-19: Week-over-Week Change
As our cases and cases in other countries like Japan are improving, the European Union is seeing an acceleration in infections (Chart 8). Unfortunately, Covid is likely here to stay and will cause occasional or seasonal outbreaks for the foreseeable future.
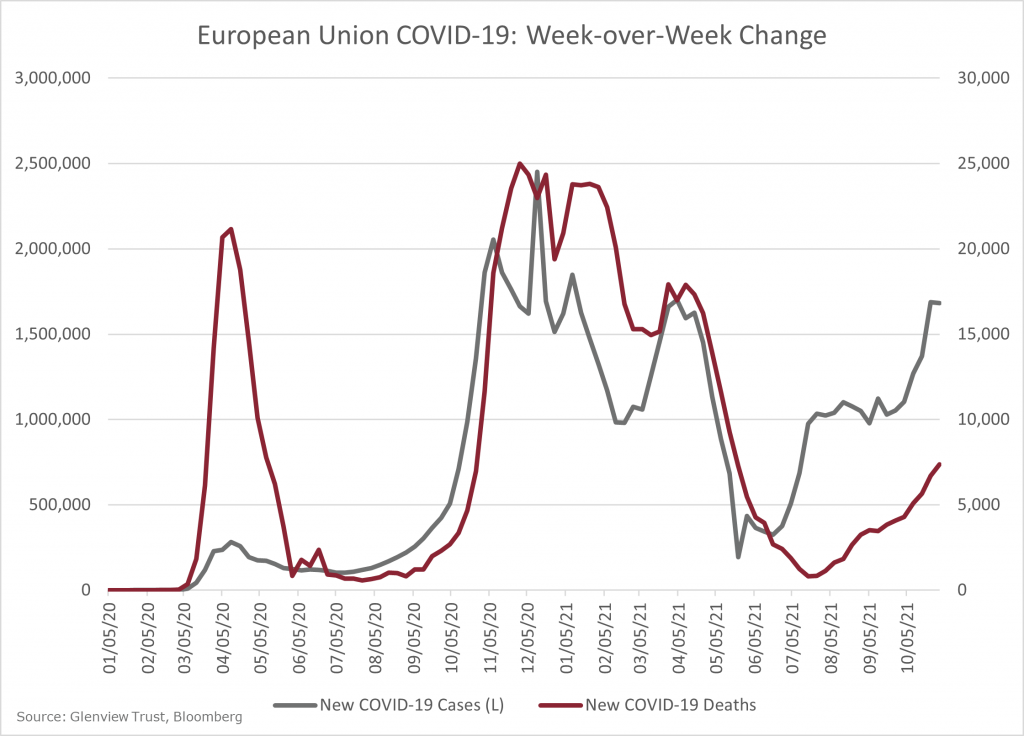
Chart 8 – European Union: Week-over-Week Change
The Ugly
The combination of Covid-induced shutdowns and increased demand has severely strained the supply chain causing many items to be in short supply even at inflated prices. Government data shows the cost of arranging freight and cargo has soared since the beginning of the year (Chart 9). The elevated shipping costs have contributed to higher consumer inflation and increased costs for corporations.
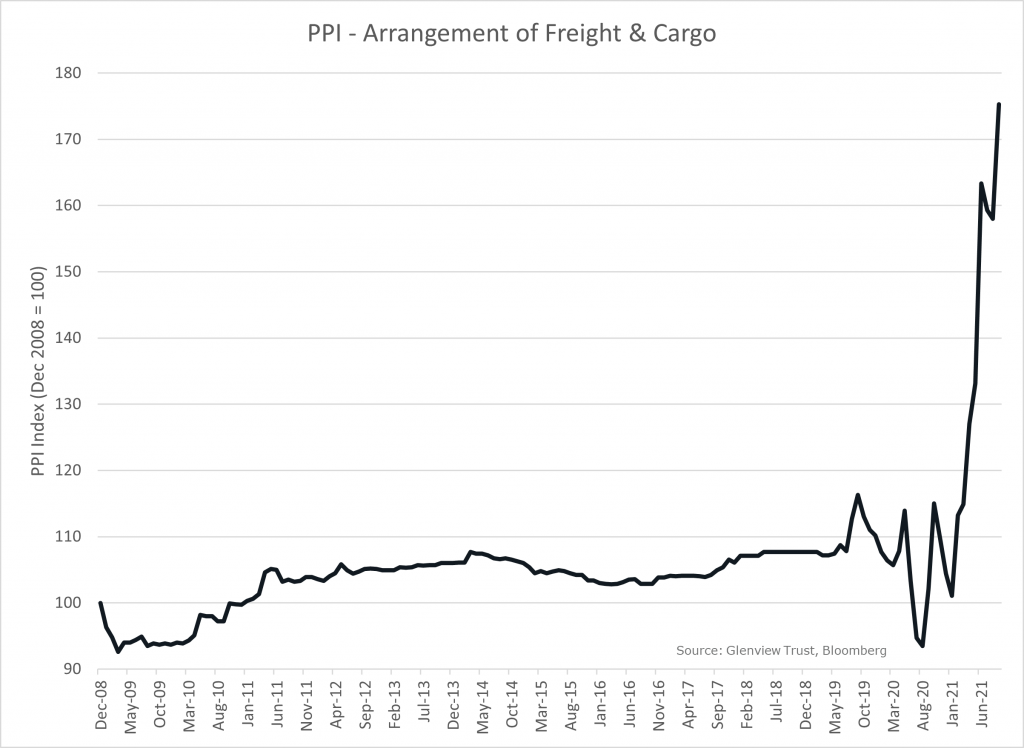
Chart 9 – PPI – Arrangement of Freight & Cargo
In addition, there are over 30 million tons of cargo waiting outside of U.S. ports to deliver goods for the holiday season (Chart 10). The lack of goods, specifically automobiles, was a significant detractor from second-quarter U.S. economic growth.
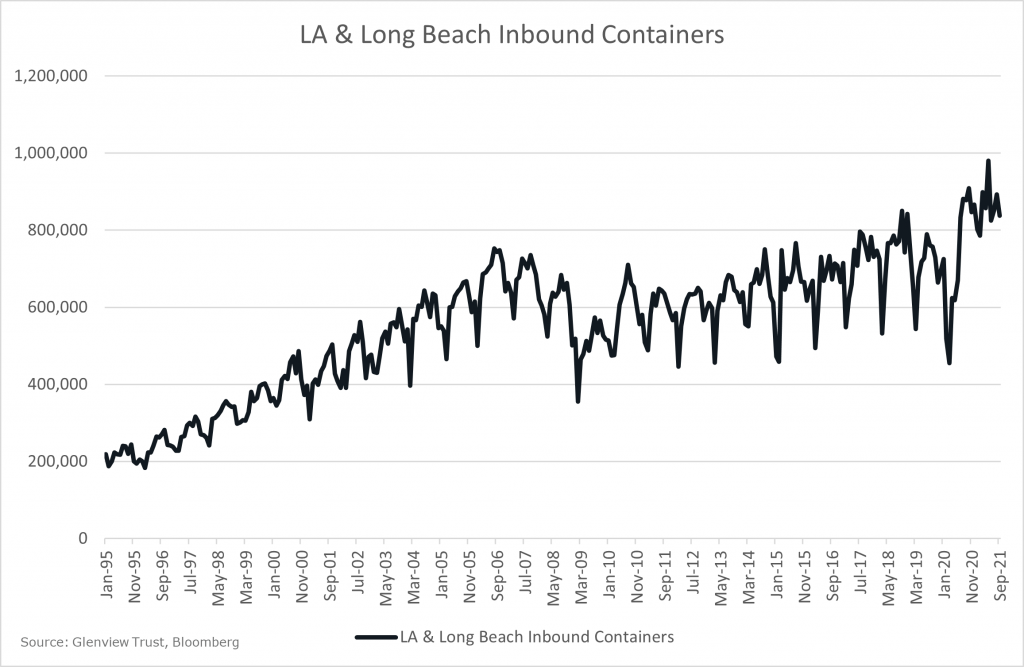
Chart 10 – LA & Long Beach Inbound Containers
There is evidence, like the decline from the recent peak for shipping rates from Shanghai to LA, that the worst supply change issues might be behind us (Chart 11). There should be some relief from semiconductor shortages for auto production in the fourth quarter. Still, it will likely take until at least the second half of 2022 for more normalization of auto production to meet the soaring demand.
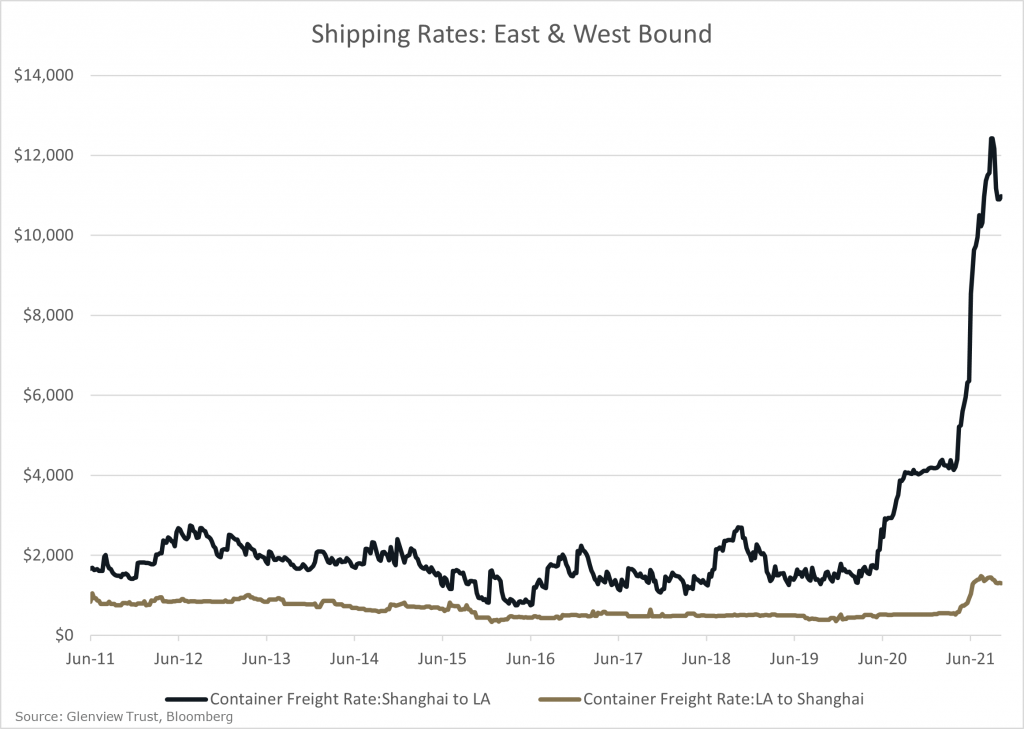
Chart 11 – Shipping Rates: East & West Bound
Inflation has been running hot since early 2021, and prices have remained elevated longer than most expected going into the year. CPI has grown at an annualized rate of 3.5% since the end of 2019. Reopening and supply chain problems are driving some of the inflation, so the current level of consumer inflation (CPI) at 5.4% year-over-year likely overstates the underlying inflation rate. Inflation at around a 3% annualized rate is a good approximation for underlying inflation in our view (Chart 12).
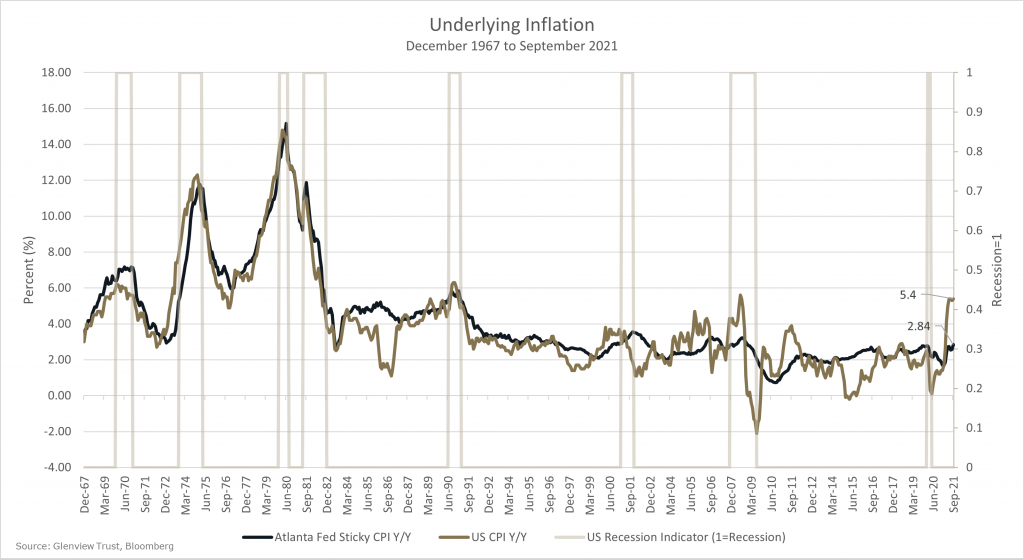
Chart 12 – Underlying Inflation
There are good reasons to believe that inflation does not get out of control. Two strong arguments are the disinflationary impulse of technology and the recent increase in productivity, with third-quarter GDP exceeding the prior peak. At the same time, jobs are still almost five million lower than the pre-pandemic peak (Chart 6). However, Glenview continues to monitor the situation closely, as there are signs that underlying inflation pressures are growing. Rent inflation has been picking up and is generally a sticky-price increase. House prices tend to lead rents by approximately three months, so more rent inflation should be expected (Chart 13).
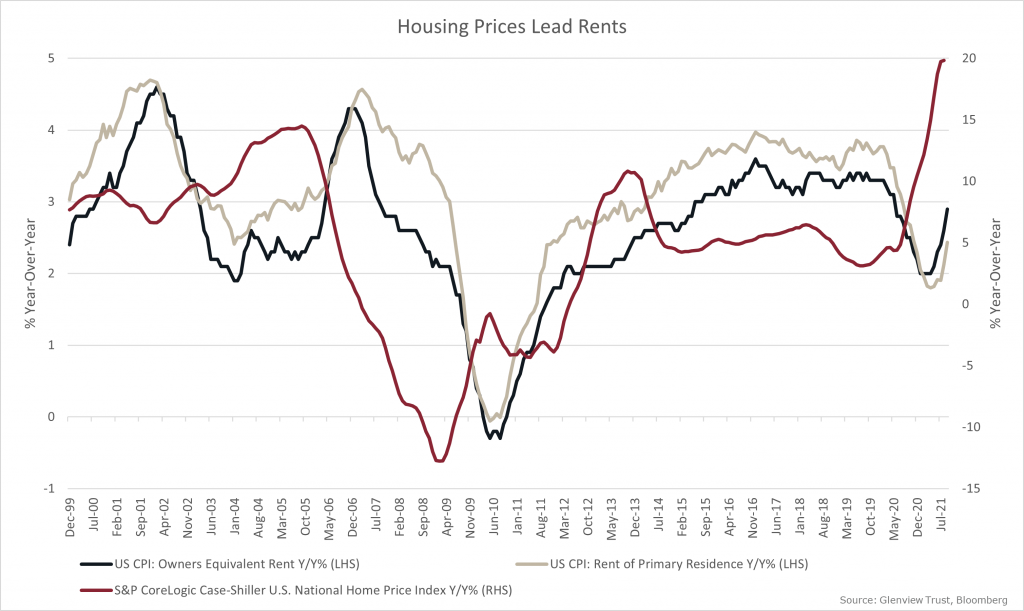
Chart 13 – Housing Prices Lead Rents
The employment cost index, which includes both employee wages and benefits, rose at the fastest quarter-over-quarter pace on record at 1.3%. While the year-over-year rate is not a record high, it is at an elevated level of 3.7%. Since wage gains tend to be sticky, this surge set off some alarm bells for those concerned about a more persistent inflation problem (Chart 14).
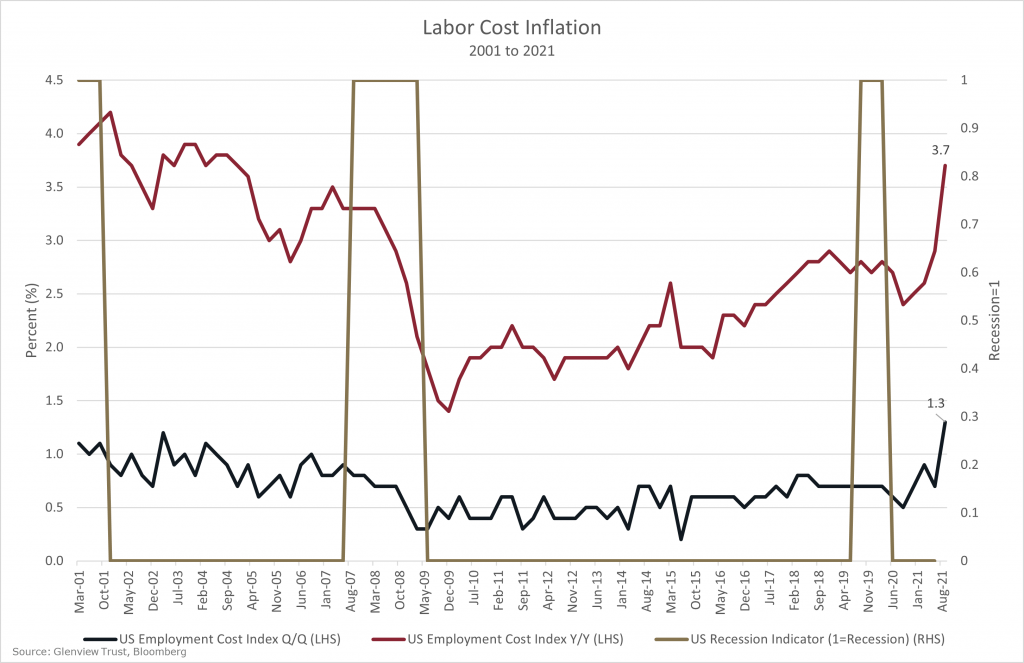
Chart 14 – Labor Costs And Recessions
Historically, stocks have done an excellent job of growing purchasing power even during periods of inflation (Chart 15). To be sure, higher inflation of more than 4% has tended to compress stock valuations. Still, quality businesses that can pass on price increases are one of the best defenses against the ravages of inflation. In addition, the use of Treasury Inflation-Protected Securities (TIPS), commodities, infrastructure, real estate, and gold can also provide inflation protection for portfolios with pros and cons to each one. Please speak with your Glenview team for a specific discussion on how these solutions might apply to your particular situation.
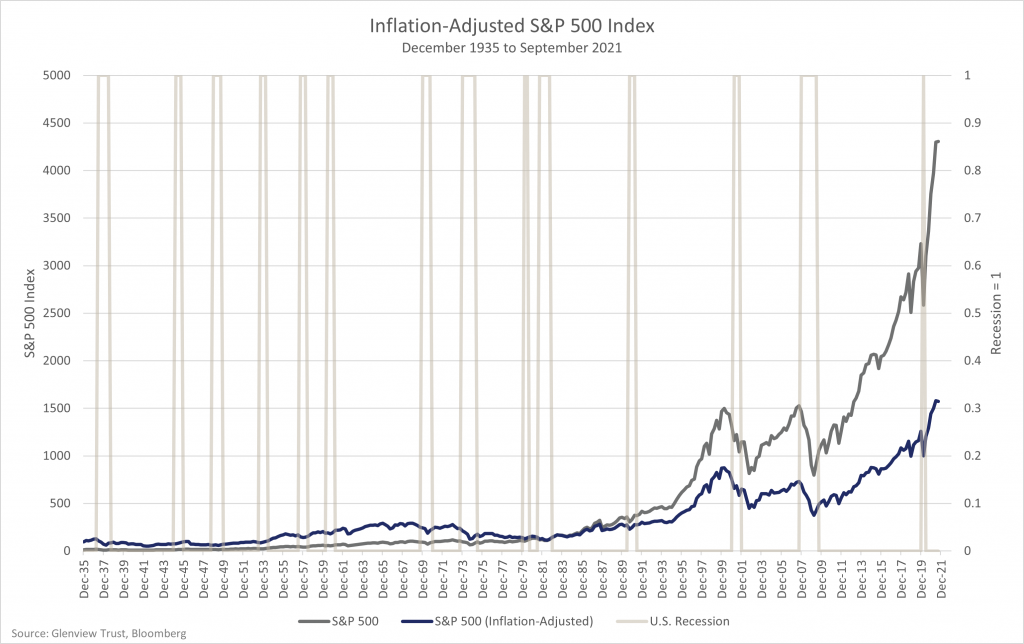
Chart 15 – Inflation-Adjusted S&P 500 Index
Our view is that the good still outweighs the bad and the ugly. Investors should remain cautiously optimistic about stocks given the solid earnings outlook and the relatively unappetizing yields provided by cash and bonds. In addition, GDP growth should improve after the poor third quarter, and the supply chain disruptions seem to be turning the corner. However, stock volatility in 2021 has been below historical levels. The worst intra-year decline for the S&P 500 has been -5% versus a long-term average decline of almost -15%. As always, investors should work with their Glenview team to ensure their asset allocation provides the financial means to persist through any volatility.
What is Bitcoin And Should You Own Some?

You may have heard on the news or read about Bitcoin or Cryptocurrency, but what exactly is it? Cryptocurrencies seem to be popular these days and are undoubtedly a hot topic of conversation. This piece is intended to provide more information regarding Bitcoin and whether or not you need to own it.
What is Bitcoin, and how did it start?
A commonly held misconception would be that Bitcoin is a company you can buy stock in, but that is not the case.
Bitcoin is a type of cryptocurrency and can act as a currencies, Bitcoins are not backed or secured by any assets or government entity. Bitcoin is a digital currency, a bit of computer code, that can be traded and exchanged almost anonymously online. All of these transactions are maintained in a single ledger that can be accessed with enough computing power. Bitcoin was originally created with the idea of developing a universally accepted currency to facilitate peer-to-peer transactions by eliminating standard currencies, processors, and banks. When Bitcoin was created in 2009, it was essentially worthless and would remain that way until it started gaining notoriety in the black market. However, Bitcoin was able to push past its seedy beginnings and into the national spotlight.
How does Bitcoin have value?
The reason Bitcoin has any value is like that of any currency because someone is willing to accept it for goods and services. In July 2020, a district court ruled that Bitcoin could be deemed as money under D.C. Financial Services Law. This development led to companies like Square and Paypal opening their own currency exchanges where one can buy and sell Bitcoin. Additionally, Bitcoin’s blockchain technology, which houses the digital public ledger of all Bitcoin transactions, holds promise for other potential decentralized applications.
Should you buy Bitcoins?
Bitcoins are an extremely speculative and risky investment. There are many reasons to temper expectations regarding the value of Bitcoin. While we mentioned above that blockchain technology showed promise and could be used for future applications; it is not proprietary. Many other cryptocurrencies, over 5,000, exist all based on blockchain technology, and an infinite number more could be created. Bitcoin just happened to be the first creation. It is important to note that being first does not always equate to long-term success. Bitcoins appear to be very valuable now as the price per coin is roughly $62,000 (Chart 1). A similar occurrence happened at the end of 2017 when the price of one Bitcoin almost reached $20,000. However, less than one year later, Bitcoin lost nearly 85% of its value, with the price per coin falling to around $3,000 at the end of 2018.
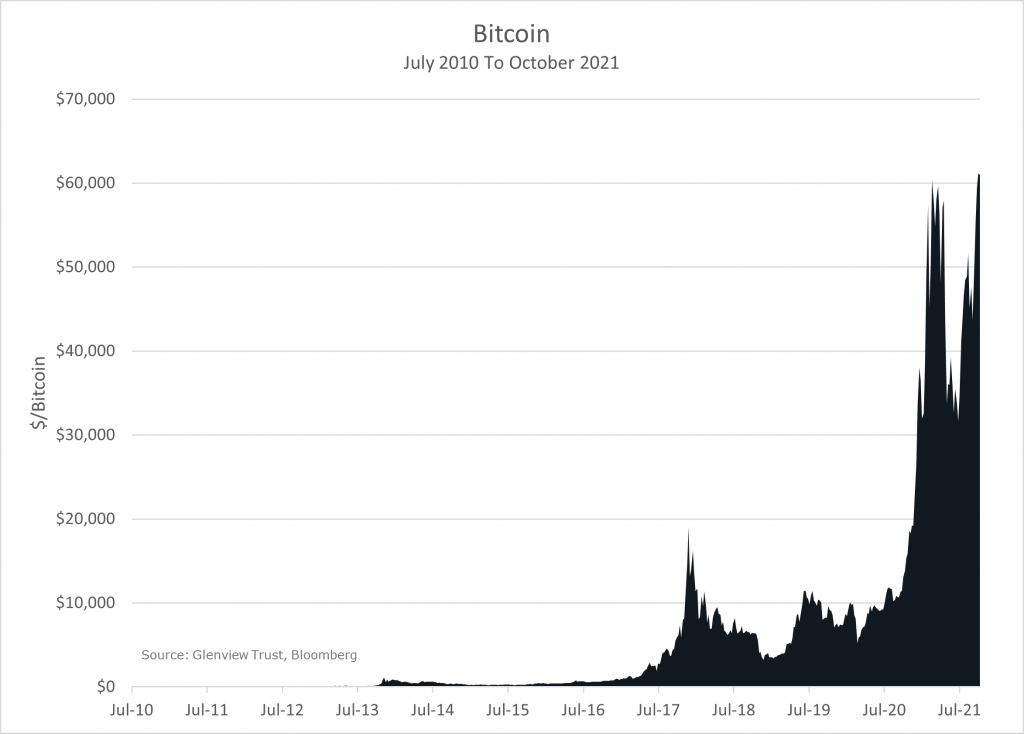
Chart – Bitcoin
Additionally, many believe that before any cryptocurrency becomes too big, government regulation will put an end to them by outlawing companies domiciled within their territory from accepting Bitcoin as a form of payment. Bitcoin is like all other technology in that it can be hacked. There are countless stories of people having their Bitcoins stolen by hackers, and since the ledger is anonymous, it is challenging to recover any lost or stolen Bitcoins.
There are other avenues to invest in blockchain technology without buying into Bitcoin or a cryptocurrency directly. Recently, exchange-traded funds (ETFs) in the U.S. were allowed to invest in Bitcoin futures. Futures are traded on many assets and are financial contracts obligating the buyer to purchase an asset at a predetermined future date and price. Owning futures enables these ETFs to use the existing financial infrastructure rather than storing Bitcoin digitally in electronic wallets. These new ETFs should track the price of Bitcoin directionally but should be expected to have lower returns due to carry costs and ETF internal expenses. There could still be a lot of money to be made in Bitcoin; however, cryptocurrencies are extremely volatile and highly speculative. Cryptocurrencies are backed by no assets and produce no cash flow, so they are worth what someone is willing to pay for them. Our recommendation is similar to any other high-risk, high-reward speculation. If you want to invest in cryptocurrencies, only do it with an amount you would be comfortable losing.
Please do not hesitate to contact your Glenview team if you have any questions.