Is Runaway Inflation a Threat?
For we can fly, we can fly up, up and away
My beautiful, my beautiful balloon
Lyrics by Jimmy Webb and recorded by the 5th Dimension
The recently reported April U.S. consumer inflation (CPI) reading at 4.2% year-over-year was the fastest pace since 2008. This rapid increase gave rise to concerns that inflation could be getting out of control in the wake of massive stimulus to combat the impact of the COVID-related economic shutdowns. Meanwhile, the Federal Reserve continues to view the recent spike in inflation as “transitory.” This piece analyzes the current inflation data and outlines the indicators Glenview is watching to judge the situation.
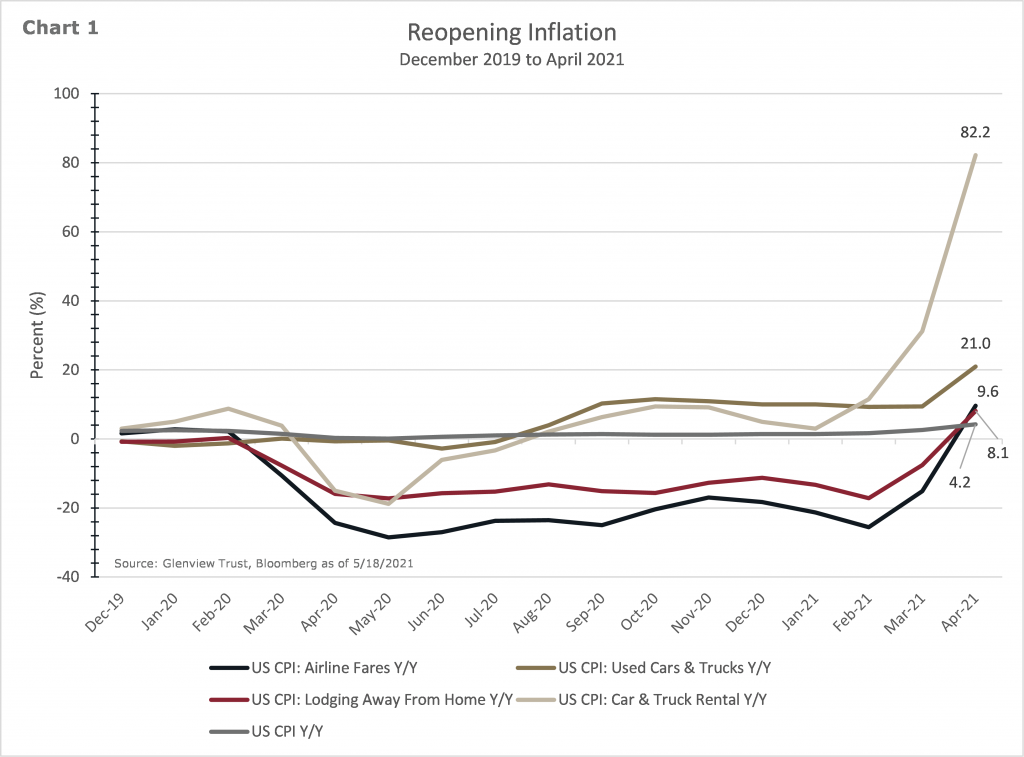
The reopening of the economy has caused some of the upward inflation pressures (Chart 1). Airline fares, car rental, and hotel costs have rebounded due to increased travel, with TSA throughput at the highest level since COVID. Used car prices have risen due to supply chain disruptions impacting new auto production and stimulus payments boosting demand. A good portion of the quick pace of these price increases should prove to be temporary as supply is restored.
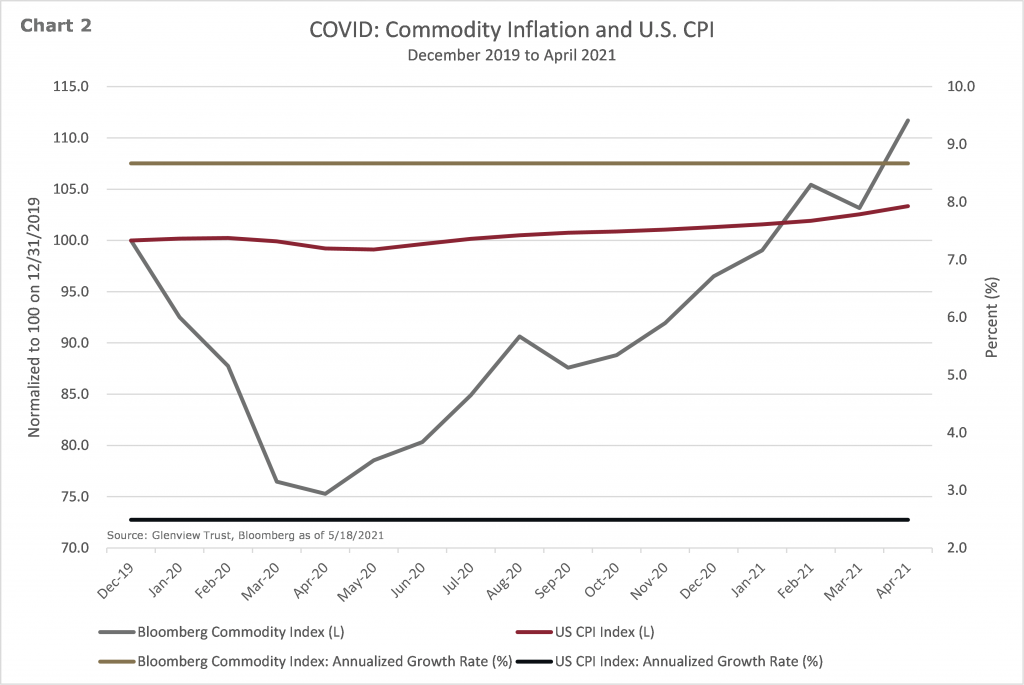
Some people point at recent commodity inflation as a worrisome sign of a significant inflation shock to come (Chart 2). While commodity prices are higher by over 48% from April 2020 to April 2021, this includes the rebound from the COVID-related plunge. Removing the COVID distortion, commodities are almost 12% higher since the end of 2019 or growing at an 8.7% annualized rate. CPI is 3.3% higher during the same period, a 2.5% annualized rate.
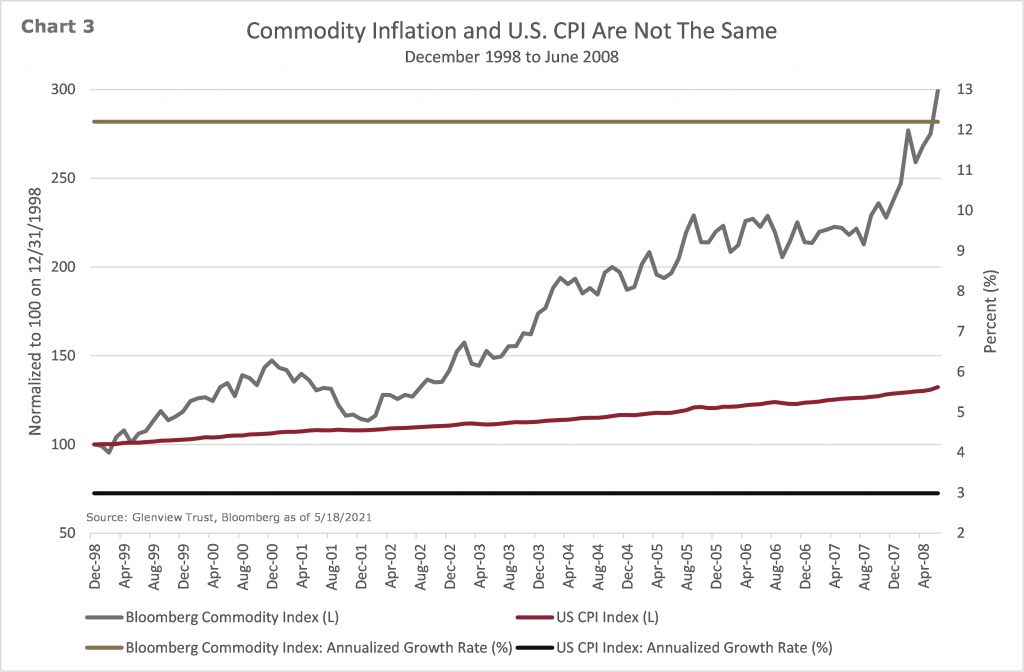
History tells us that sharp rises in commodity prices do not always lead to runaway inflation (Chart 3). From December 1998 to June 2008, commodity prices tripled, equating to a 12.2% annualized growth rate. During the same period, consumer prices grew about 32% or at a 3% annualized rate. While there are multiple explanations for this phenomenon, lower energy intensity and technology remain very relevant now. A large portion of the commodity basket consists of energy-related items. The global economy has become more efficient at generating more economic activity per barrel of oil, so the price becomes less impactful on final product pricing. Technological innovations are inherently deflationary, with new developments in artificial intelligence, 5G, and robotics continuing the trend.
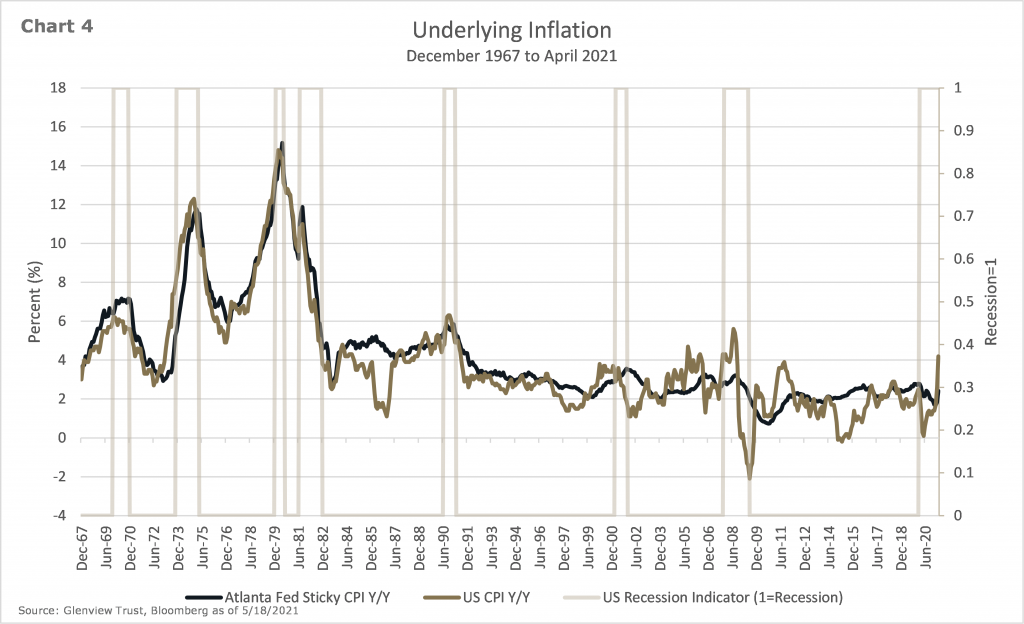
The impact of reopening and base effects (comparisons with the low prices during the COVID shutdown) certainly boosted inflation readings, so at least some amount of the inflation rise should prove “transitory,” as the Federal Reserve likes to say. The key will be how much of the inflation becomes more permanent. The Atlanta Fed’s Sticky CPI did an excellent job of indicating the stickiness of inflation in the 1970s and our period of disinflation since (Chart 4). While this indicator has turned higher, it has not reached a troubling level.
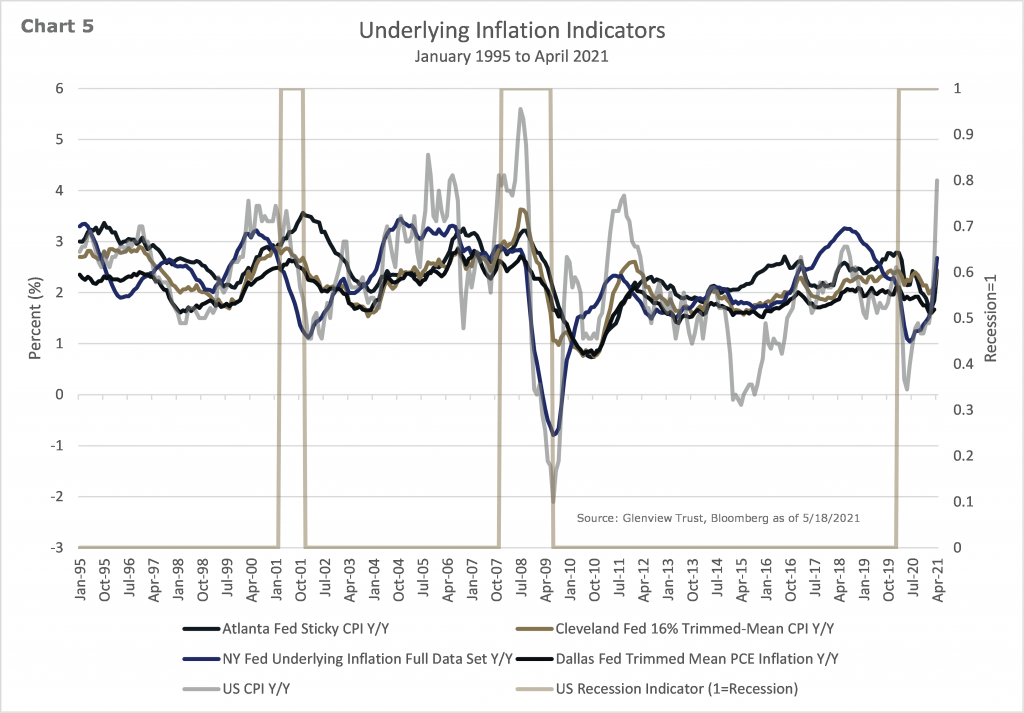
Glenview monitors several measures of the underlying trend of inflation from various Federal Reserve banks (Chart 5). The inflation measures have turned higher, but none have exceeded the ranges of recent history.
Here is a quick summary of each measure:
- Atlanta Fed Sticky CPI Y/Y: This measure is a weighted basket of items that change price relatively slowly. On a year-over-year basis for April, the series is up 2.4 percent.
- NY Fed Underlying Inflation Gauge (UIG) Full Data Set Y/Y: Underlying inflation is defined as the persistent part of the common component of monthly inflation. On a year-over-year basis for April, the series is up 2.7 percent.
- Cleveland Fed 16% Trimmed-Mean CPI Y/Y: This is a measure of core inflation that excludes the most extreme monthly price changes. This series excludes 8% of the CPI components with the highest and lowest one-month price changes. On a year-over-year basis for April, the series is up 2.4 percent.
- Dallas Fed Trimmed Mean PCE Inflation Y/Y: It measures core inflation in personal consumption expenditures (PCE) using the price changes for the individual components of spending. The most extreme observations at both ends of the spectrum are then removed. On a year-over-year basis for March, the series is up 1.7 percent.
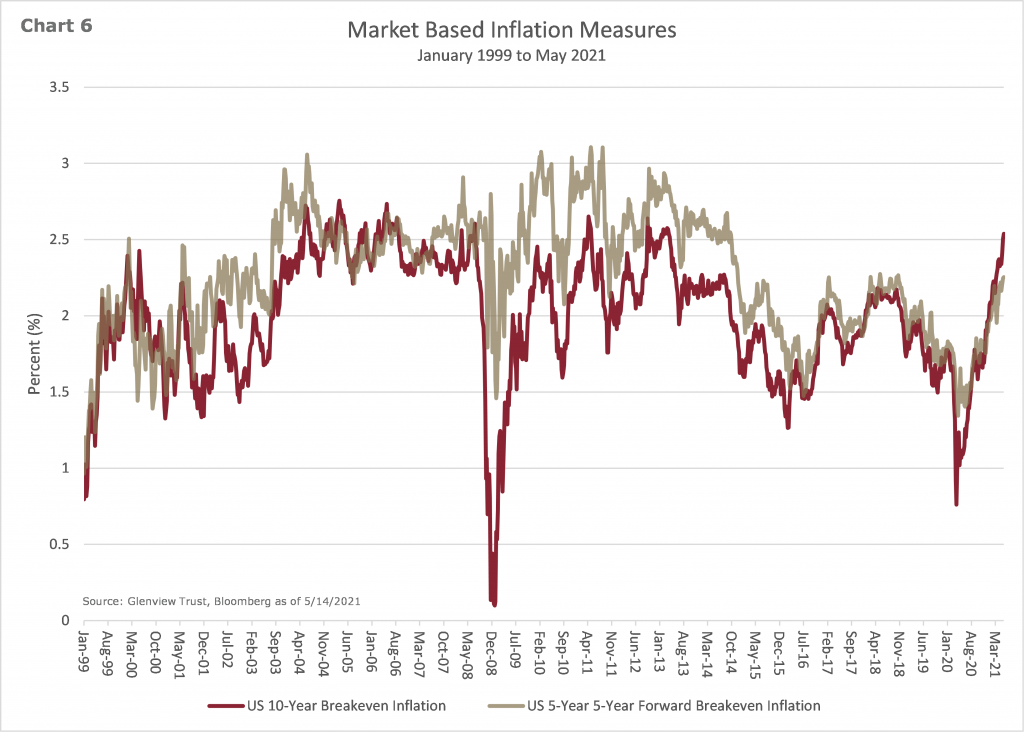
While economic data is essential, market-based measures give us crucial insights into the level of inflation being priced into financial assets (Chart 6). Unexpected changes in inflation typically have a more considerable impact on financial market prices.
Here is a quick summary of the two measures:
- S. 10-Year Breakeven Inflation: This measure of expected inflation is derived from 10-Year Treasury yield and 10-Year Treasury Inflation-Protected Securities (TIPS) yield. The latest value implies what market participants expect inflation to be in the next ten years, on average.
- S. 5-Year 5-Year Forward Breakeven Inflation: This series is a measure of expected inflation, on average, over the five-year period that begins five years from today.
In summary, the jury is still out on whether this increase in inflation will prove temporary or evolve into something more permanent. Because the CPI index reached its low during COVID in May 2020, the upcoming year-over-year CPI for May 2021 on June 10 will be even higher than the April reading of 4.2%. It will remain essential to distinguish between the COVID impacts and more ongoing price trends. So far, the evidence points to the majority of the inflation increase being likely to be more transitory. Glenview will continue to monitor and adapt to the situation accordingly while keeping you informed.
Please do not hesitate to contact your Glenview team or me if you have any questions.
Bill Stone, CFA, CMT
Chief Investment Officer