 At a little more than one year past the COVID and lockdown‐induced stock market low, it seems like an appropriate time to look at how this recession differs from a more typical business cycle and the implications of those differences. The most significant difference was that a governmentmandated lockdown of businesses was the cause of this collapse in economic activity. Recessions are typically caused by economic overheating or an extraneous shock, like soaring oil prices, rather than government decree.
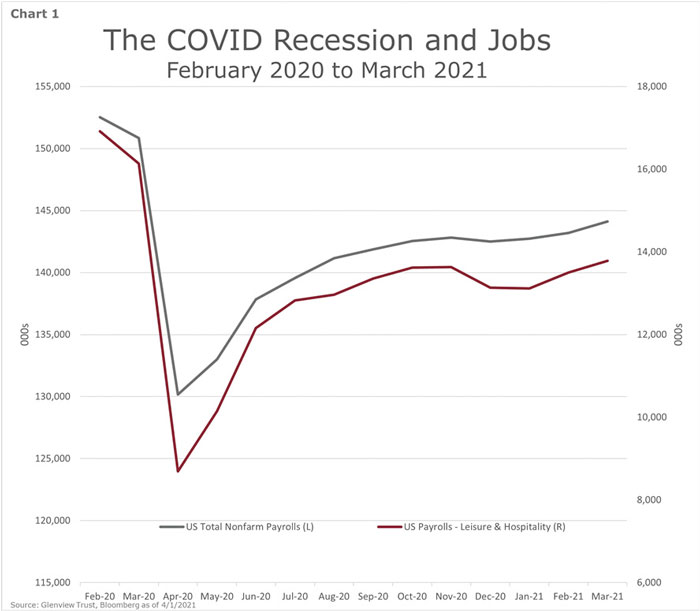
 The sudden stop in the economy caused employment to plunge. Both the pace and amount of job losses were breathtaking in specific segments of the workforce (Chart 1). Due to government restrictions and consumers’ avoidance of in‐person services and travel, hospitality and leisure jobs were almost cut in half in less than two months. To put it into perspective, hospitality and leisure employment in April 2020 was last at this level in 1988. In other words, COVID wiped out over thirty years of job gains in those sectors in less than two months. While there were job losses across all industries, white‐collar and higher‐paying jobs were less impacted since many of those roles can be performed remotely.
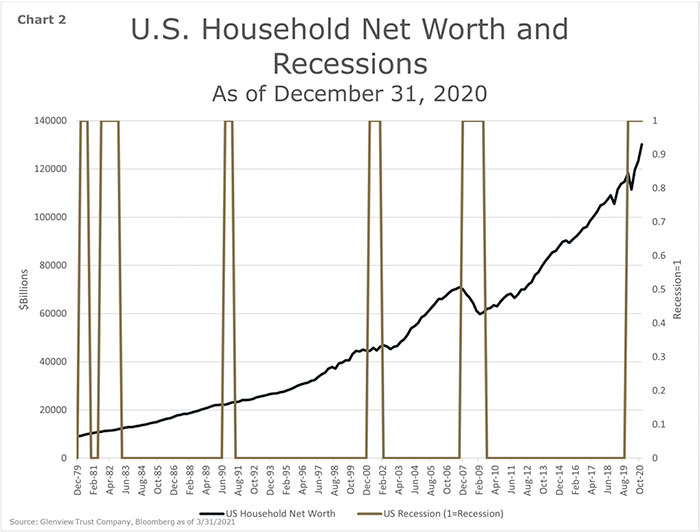
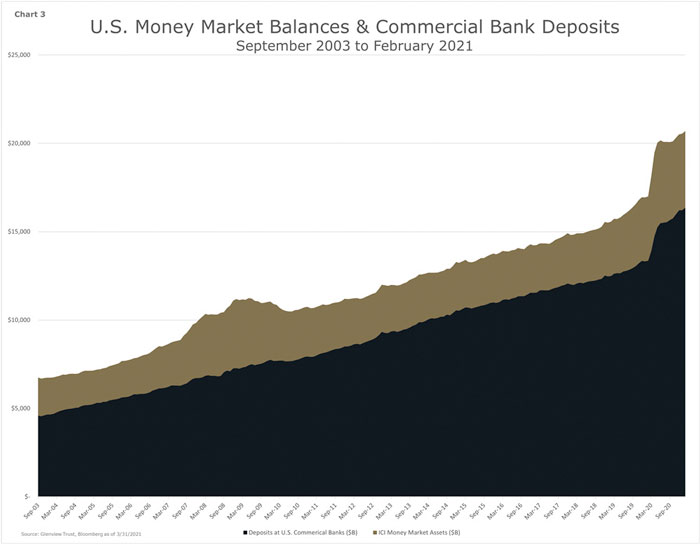 With a growing preference for living with more social distance due to COVID, U.S. housing prices rose by over ten percent in 2020. While the net worth of U.S. households typically declines during deep recessions, it grew by ten percent in 2020 (Chart 2). This increase was driven primarily by the rise in real estate and stock prices. Also, the amount of cash held at banks and money market funds rose by twenty percent and reached an all‐time high during this recession (Chart 3).
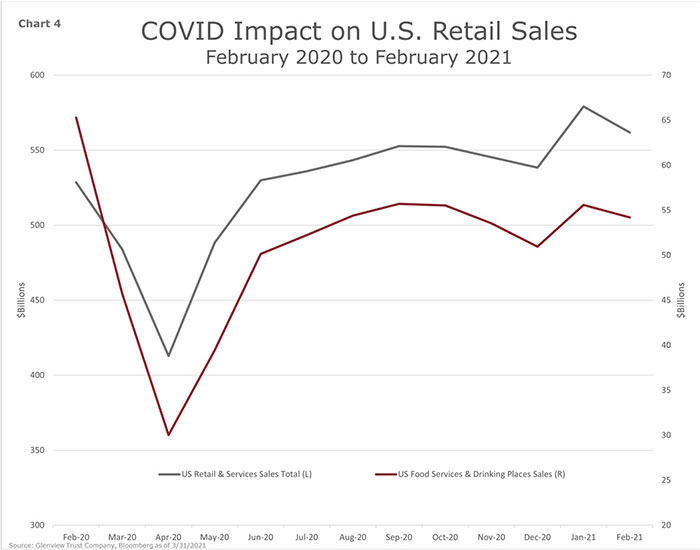 Consumer spending plunged with the imposition of lockdowns. But unlike previous recessions, overall spending exceeded the pre‐COVID peak after only four months (Chart 4). Due to restrictions, expenditures on travel and services, like restaurants and bars, remain well below peak levels. Spending on work‐from‐home and housing‐related items has been a critical driver to the rebound so far.
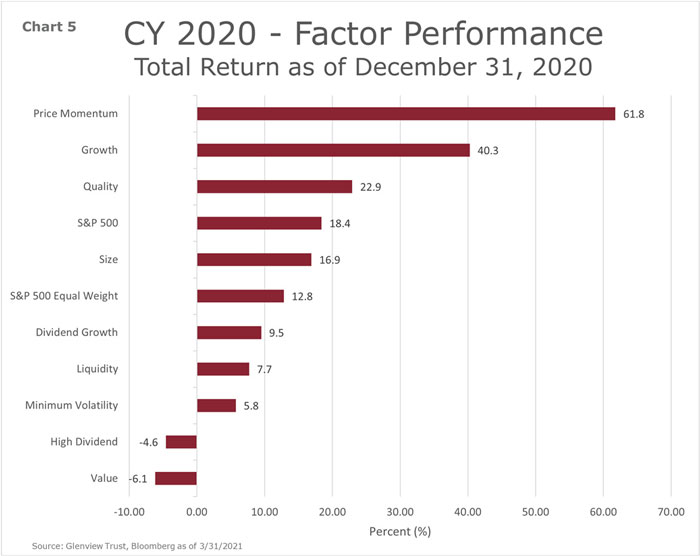
The bifurcated performance of stocks in 2020 reflected the disparate economic impact of COVID on companies and households (Chart 5). The best‐performing stocks in 2020 were growth stocks. Many of these growth stocks were technology companies that benefitted from the work from home (WFH) environment. For example, Apple (AAPL) reported record earnings despite the pandemic. On the other side of the coin, value and high dividend stocks fared poorly as those companies suffered a significant earnings decline due to the economic downturn. Overall the strong performance of stocks in 2020 reflected: 1) the strong earnings performance of companies benefitting from WFH; 2) the ultralow interest rate environment; 3) the market pricing in the future expected strong earnings recovery.
 The first quarter of 2021 likely gave us a small glimpse of what lies ahead for the economy and markets. Glenview tracks a large number of highfrequency, non‐tradition economic indicators to measure the extent of reopening of the economy. For example, mobility data, which uses mobile phone data to measure individuals’ movements, is now at a post‐COVID high. The March nonfarm payrolls report showed a rebound in jobs created and, more importantly, a surge in leisure and hospitality jobs which were at ground zero in the COVID shutdown. While the February weather disruptions will likely hold back economic growth and the stimulus checks did not arrive until the second half of March, first‐quarter GDP growth should still be impressive and in the high single digits.
Continued reopening and the resultant recovery of the lagging services component of the U.S. economy should drive strong economic growth for 2021. Second‐quarter GDP growth could accelerate to around 10%. Calendar year U.S. GDP growth for 2021 is likely to be about 7% after a decline of ‐3.5% in 2020. To put the expected rebound’s strength into perspective, U.S. GDP growth averaged about 2.5% from 2015 to 2019. The robust economic growth should translate into a strong rebound in corporate earnings, with consensus earnings estimates expecting S&P 500 earnings to grow by over 25% in 2021.
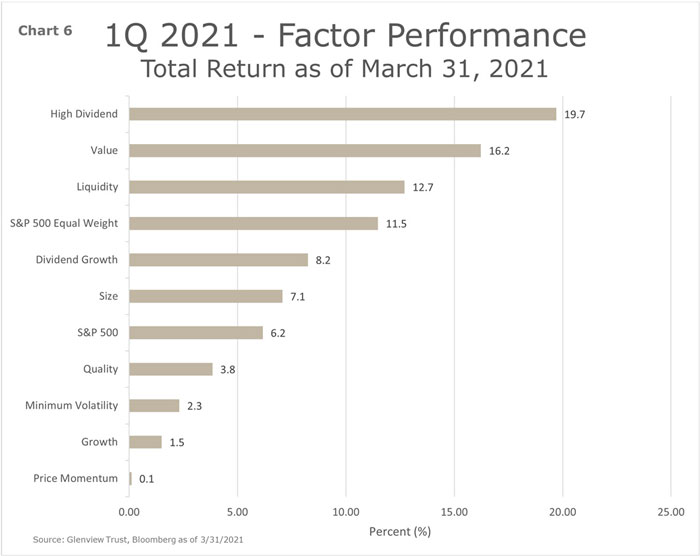 The market has already begun to reflect the high likelihood of continued reopening with a robust economic and earnings recovery. This realization precipitated by the COVID vaccine resulted in a strong rotation away from the growth and work from home stocks to companies with more economic exposure (Chart 6). For example, value and higher dividend stocks were the worst performers in 2020 and became the top performers for the first quarter of 2021.
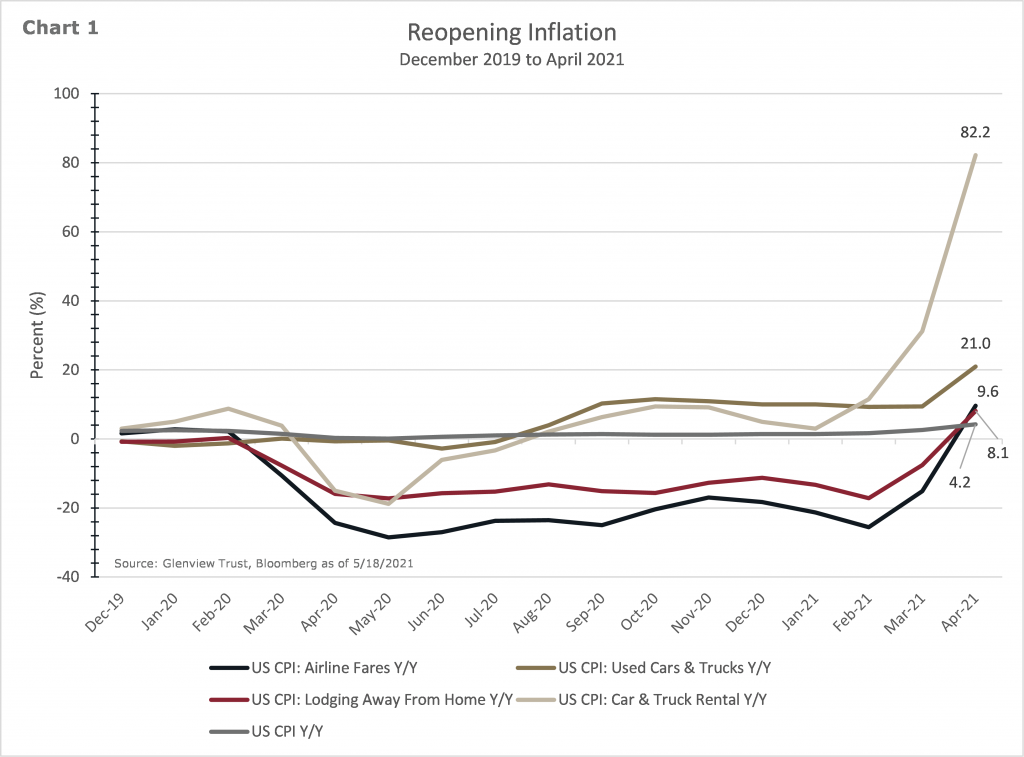
Our view is that the market is correct in being optimistic about economic growth and earnings. Consensus estimates might even be too low, in our opinion. Though to temper our seemingly ebullient sentiment, stocks moved higher last year in advance of the economy’s fundamental improvement. It would not be a surprise to see stocks underperform the economic improvements as the mirror opposite of stock outperformance versus the economy last year. Also, the market faces risks from possible inflation, reopening stumbles, and potential tax increases. Inflation is likely to reach 3.5% year‐over‐year in the coming months, but much of that increase is due to comparisons with lockdown prices. Our opinion is that it is too early to be convinced of runaway inflation, but we are monitoring the situation closely. Even without a rise in inflation, the low yields on government bonds offer an unappetizing return potential.
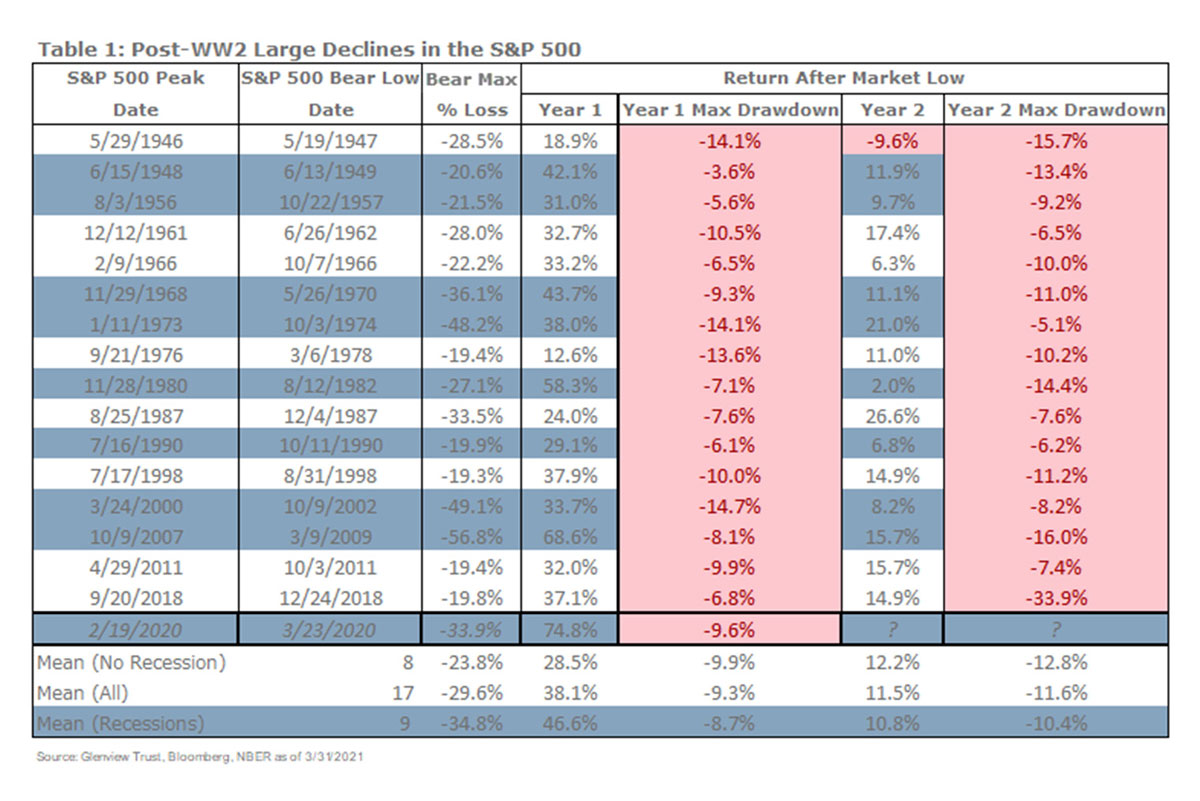
Glenview analyzed the returns on stocks following all the bear markets since World War Two, looking for insights into the current environment (Table 1). The COVID bear market set records as the most rapid decline and the most substantial rebound in the year following the low. In terms of the future, all but one second year after a bear market low was higher. Interestingly, stock returns were almost always lower in year two, and intra‐year declines were generally deeper. This analysis is consistent with our view that investors should remain cautiously optimistic about stocks but aware that volatility is likely to increase. As always, investors should work with their Glenview team to ensure their asset allocation provides the financial means to persist through any volatility.
Please do not hesitate to contact your Glenview team or me if you have any questions.

 At a little more than one year past the COVID and lockdown‐induced stock market low, it seems like an appropriate time to look at how this recession differs from a more typical business cycle and the implications of those differences. The most significant difference was that a governmentmandated lockdown of businesses was the cause of this collapse in economic activity. Recessions are typically caused by economic overheating or an extraneous shock, like soaring oil prices, rather than government decree.
 The sudden stop in the economy caused employment to plunge. Both the pace and amount of job losses were breathtaking in specific segments of the workforce (Chart 1). Due to government restrictions and consumers’ avoidance of in‐person services and travel, hospitality and leisure jobs were almost cut in half in less than two months. To put it into perspective, hospitality and leisure employment in April 2020 was last at this level in 1988. In other words, COVID wiped out over thirty years of job gains in those sectors in less than two months. While there were job losses across all industries, white‐collar and higher‐paying jobs were less impacted since many of those roles can be performed remotely.
 With a growing preference for living with more social distance due to COVID, U.S. housing prices rose by over ten percent in 2020. While the net worth of U.S. households typically declines during deep recessions, it grew by ten percent in 2020 (Chart 2). This increase was driven primarily by the rise in real estate and stock prices. Also, the amount of cash held at banks and money market funds rose by twenty percent and reached an all‐time high during this recession (Chart 3).
 Consumer spending plunged with the imposition of lockdowns. But unlike previous recessions, overall spending exceeded the pre‐COVID peak after only four months (Chart 4). Due to restrictions, expenditures on travel and services, like restaurants and bars, remain well below peak levels. Spending on work‐from‐home and housing‐related items has been a critical driver to the rebound so far.
 The first quarter of 2021 likely gave us a small glimpse of what lies ahead for the economy and markets. Glenview tracks a large number of highfrequency, non‐tradition economic indicators to measure the extent of reopening of the economy. For example, mobility data, which uses mobile phone data to measure individuals’ movements, is now at a post‐COVID high. The March nonfarm payrolls report showed a rebound in jobs created and, more importantly, a surge in leisure and hospitality jobs which were at ground zero in the COVID shutdown. While the February weather disruptions will likely hold back economic growth and the stimulus checks did not arrive until the second half of March, first‐quarter GDP growth should still be impressive and in the high single digits.
 The market has already begun to reflect the high likelihood of continued reopening with a robust economic and earnings recovery. This realization precipitated by the COVID vaccine resulted in a strong rotation away from the growth and work from home stocks to companies with more economic exposure (Chart 6). For example, value and higher dividend stocks were the worst performers in 2020 and became the top performers for the first quarter of 2021.